Table of Contents
Indian Maize Market Price Forecast 2026–27, Research date: 24 October 2026 · Forecast horizon: April 2027 · Market: India, with special relevance to Telangana and southern India
India’s maize market is entering a potentially important transition. Record production in the previous crop year has increased the supply base, but weaker monsoon performance, reduced kharif acreage, the possibility of lower rabi output, and continuing demand from poultry feed, starch and ethanol industries could tighten the market over the coming six months.
The key question is whether the expected reduction in new-crop supply will be large enough to offset the heavy production and carryover supplies from the previous season.
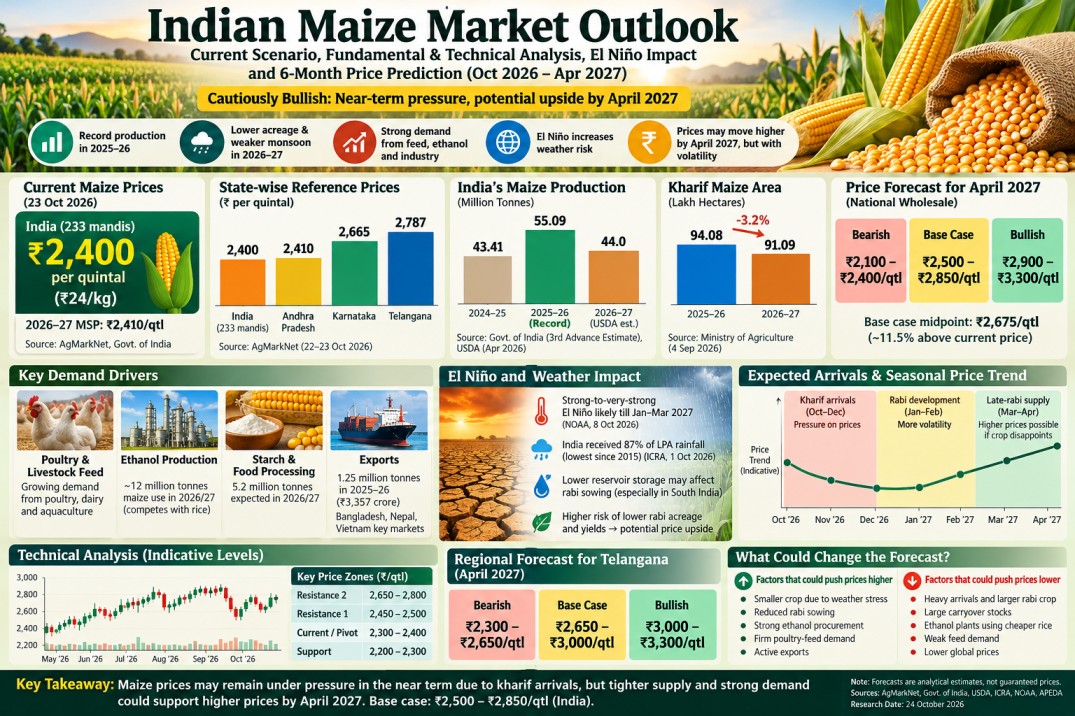
1. Current maize prices and the six-month forecast
Latest reported national mandi benchmark
₹2,400/quintal
23 October 2026 · Median modal price across 233 reporting mandis, based on AgMarkNet data
Current benchmark
₹24/kg
2026–27 MSP
₹2,410/qtl
Sources: ACROP’s AgMarkNet-based national price summary and the Government of India’s MSP announcement.
The current national benchmark is a useful reference, not a guaranteed price for every mandi. Local prices vary with moisture, grain quality, transport costs, buyer demand and the volume arriving at market yards.
My provisional six-month outlook: maize has potential to move higher by April 2027, but the likely path is uneven. Heavy kharif arrivals can limit prices in the near term, while smaller crops or weaker-than-expected irrigation-supported rabi production could strengthen prices later.
The following forecast ranges are my analytical estimates, not official government or exchange forecasts.
| Scenario for April 2027 | Indicative wholesale price |
|---|---|
| Bearish: ample supplies and subdued demand | ₹2,100–₹2,400/qtl |
| Base case: moderate tightening of supply | ₹2,500–₹2,850/qtl |
| Bullish: crop shortfall and stronger industrial demand | ₹2,900–₹3,300/qtl |
These are indicative national-market ranges. Prices in individual Telangana, Karnataka or Andhra Pradesh mandis may trade above or below them. The evidence behind these estimates—and the conditions that would invalidate them—are examined below.
2. Current market situation: India and Telangana
The national benchmark hides a significant difference between producing regions. The latest available figures show that several southern markets are trading above the national median.
| Market | Latest reported reference price | Reporting date |
|---|---|---|
| India, 233 reporting mandis | ₹2,400/qtl | 23 Oct 2026 |
| Telangana, 22 reporting mandis | ₹2,787/qtl | 23 Oct 2026 |
| Andhra Pradesh, 43 reporting mandis | ₹2,410/qtl | 23 Oct 2026 |
| Karnataka, 28 reporting mandis | ₹2,665/qtl | 22 Oct 2026 |
Source: AgMarkNet-based price summaries. These are each market’s median modal prices, not identical grades or a single nationwide wholesale average.
For farmers around Nagarkurnool, Telangana, a reported Nagarkurnool APMC modal price was ₹2,833 per quintal on 17 October 2026. This is a useful local reference, but it should not be treated as the confirmed price for 24 October.
Latest Mandi Rates · BhumiAI
What this tells us: regional demand, grain quality and local availability are currently important price determinants. A Telangana farmer may receive considerably more than the national benchmark, while another farmer selling similar-looking maize in a different market may receive less.
The daily national data feed also did not report total arrivals for 23 October. Consequently, current arrival pressure can be assessed from the harvest calendar and market pattern, but a reliable nationwide daily tonnage should not be invented.
3. Production analysis: Is India likely to have a maize surplus?
This is the most important fundamental question for the coming six months.
The previous harvest was exceptionally large
The Government of India’s Third Advance Estimates, released on 27 May 2026, put maize production for the 2025–26 crop year at a record 55.093 million tonnes, compared with 43.409 million tonnes in the preceding year.
Press Information Bureau
However, the USDA Foreign Agricultural Service’s April 2026 report used a different and earlier estimate series. It estimated production at 48.5 million tonnes for its 2025/26 marketing year and projected 44 million tonnes for 2026/27. That forecast anticipated reduced planting because prices had weakened.
These figures should not be combined as though they were successive estimates from one consistent series. They differ in reporting vintage and crop-year or marketing-year accounting. The Government’s May estimate is the later official crop-year estimate; the USDA projection is useful as a directional warning about the next supply cycle, not as a final forecast for India’s 2026–27 crop.
Kharif acreage is already a warning signal
The Government’s weekly crop-sowing report for 4 September 2026 showed:
Kharif maize area, 2025–26- 94.08 lakh ha
Kharif maize area, 2026–27- 91.09 lakh ha
Reduction: 2.99 lakh hectares, or approximately 3.2% year on year, as of the reporting date.
Source: Ministry of Agriculture and Farmers Welfare, Government of India.
Lower acreage does not automatically mean a proportional reduction in production. Better yields could offset part of the decline. But acreage is an early warning indicator: when it falls at the same time as monsoon conditions deteriorate, the possibility of a smaller harvest becomes more credible.
Production outlook for the 2026–27 crop
The current evidence points in two directions.
The bearish factor is the previous record harvest, which can leave grain in storage, in commercial channels or available for later sale. This creates competition for new-crop maize, especially during the peak arrival period.
The bullish factor is the lower reported kharif acreage combined with weather risks and possible reductions in irrigated rabi planting. If production falls while feed and industrial users continue buying, the surplus could shrink quickly.
My assessment: the previous year’s record production is a real restraint on prices in the near term, but it is not sufficient evidence to assume a record harvest again in 2026–27.
4. El Niño: Why it matters for maize prices
El Niño is an important factor in this year’s agricultural risk assessment, but it should be interpreted carefully.
The US National Oceanic and Atmospheric Administration’s Climate Prediction Center reported on 8 October 2026 that a strong-to-very-strong El Niño was likely through January–March 2027. The International Research Institute’s 19 October update also reported exceptionally strong warming in the equatorial Pacific.
Meanwhile, ICRA’s 1 October 2026 assessment stated that India received only 87% of its long-period-average rainfall during the 2026 southwest monsoon, the lowest since 2015. It also warned that below-average reservoir storage could affect rabi sowing, with particularly severe deficits in southern India.
The transmission from weather to maize prices
Strong El Niño and deficient monsoon
↓
Potentially lower soil moisture and reservoir storage
↓
Greater risk to rabi acreage, irrigation and crop yields
↓
Potentially smaller maize arrivals in late winter and spring
↓
Upside risk to wholesale prices
The chain is conditional: it depends on how water availability affects maize-growing districts, not simply on whether El Niño exists.
For maize, the most relevant issue over the next six months is the water position entering the rabi crop and the yields ultimately achieved. El Niño may increase risk, but irrigation, local rainfall, crop management and groundwater availability can moderate its impact. The Indian government has also cautioned that El Niño is not the only determinant of the Indian monsoon.
Market implication: weather-related price pressure may become stronger between January and April 2027 if crop reports confirm a reduction in output. Before that confirmation, expectations alone may create volatility without producing a sustained price rise.
5. Maize utilization: Where is demand coming from?
India’s maize price is increasingly influenced by industrial and feed demand, rather than only by food consumption.
The USDA Foreign Agricultural Service identifies animal feed, the ethanol blending programme and industrial processing as major components of Indian maize demand. Its April 2026 outlook expected animal-feed demand to grow by about 4% in 2026/27. It projected maize use for ethanol at 12 million tonnes in that marketing year, while noting that ethanol plants may substitute government-supplied rice and other grains when their economics are more favourable.
1. Poultry and livestock feed
Maize is an important energy ingredient in poultry feed and is also used by dairy and aquaculture feed producers. Growth in commercial poultry and feed production supports demand, although buyers can change formulations when maize becomes expensive relative to other feed ingredients.

2. Ethanol production
The ethanol blending programme has encouraged the expansion of grain-based ethanol capacity and helped create a large new source of maize demand. The important qualification is that maize competes with rice and other eligible grain feedstocks. If subsidised rice becomes more attractive, ethanol plants can reduce their maize purchases.

3. Starch and food processing
The starch industry uses maize for products supplied to food processing, textiles, paper and other industrial customers. The USDA projected maize use by the starch industry at 5.2 million tonnes for 2026/27, up from an estimated 5 million tonnes in the preceding year.

4. Exports
APEDA reports that India exported 1.25 million tonnes of maize in 2025–26, valued at approximately ₹3,357.54 crore. Bangladesh, Nepal and Vietnam were the leading listed destinations. Export demand can draw grain away from domestic markets when Indian maize is competitively priced.
What matters most for prices?
Ethanol is a significant potential source of additional demand, but it is not a guaranteed price floor. Poultry-feed demand provides another important outlet, while changes in feed formulation, rice availability and export competitiveness can alter how much maize buyers purchase at any given price.
The most bullish combination would be a smaller crop, active ethanol procurement and firm poultry-feed demand at the same time.
The bearish combination would be strong arrivals, weak feed demand and ethanol plants switching to cheaper alternatives.
6. Arrivals analysis: What should happen from October 2026 to April 2027?
India’s maize production is distributed across three major crop seasons. APEDA’s published crop calendar assigns roughly 60% of production to kharif, 32% to rabi and 8% to summer maize. These proportions are indicative and can vary across seasons.
The arrival pattern is therefore central to the price forecast.
| Period | Expected supply and demand conditions | Likely price implication |
|---|---|---|
| October–December 2026 | Kharif harvesting and marketing; buyers may have multiple sources of grain | Sideways to weaker if arrivals are heavy |
| January–February 2027 | Rabi crop development and early arrivals; clearer information on water and crop conditions | More volatility as supply expectations change |
| March–April 2027 | Increasing significance of late-rabi supply and emerging estimates of crop size | Higher prices become more plausible if the crop disappoints |
This is a seasonal assessment, not a report of measured national arrival volumes for each future month.
The main analytical distinction is between grain that is being harvested now and grain that may be available later. Near-term arrivals can pressure the market even when the next crop is at risk. Prices may therefore move lower first and recover later if supply tightens.
7. Technical analysis of maize prices
Technical analysis is less reliable for maize than for a highly liquid exchange-traded contract. India has many local mandi markets, differences in grade and moisture, and uneven reporting. There is no single national spot price that every buyer and seller receives.
Still, recent cash-market observations help identify useful price zones.
Reported maize market reference prices
Selected mandi reference prices in ₹ per quintal; dates and aggregation methods differ.
₹0₹750₹1,500₹2,250₹3,000IndiaAndhra PradeshKarnatakaTelangana
Sources: ACROP’s AgMarkNet-based summaries for 22–23 October 2026. The chart compares reported market medians, not identical lots or a continuous futures series.
Indicative technical levels
These are analytical zones inferred from recent market levels and regional price distributions. They are not published exchange support and resistance levels.
| Level | National spot-market interpretation |
|---|---|
| ₹2,200–₹2,300/qtl | Lower support zone if selling pressure increases |
| ₹2,300–₹2,400/qtl | Important near-term price area around the current national benchmark |
| ₹2,450–₹2,500/qtl | Initial resistance zone |
| ₹2,650–₹2,800/qtl | Higher resistance area if stronger demand spreads across markets |
Bullish signal: prices hold above the ₹2,400 area and repeatedly move through ₹2,500 across several producing markets, despite continued arrivals.
Bearish signal: prices fail to sustain a move above ₹2,500 while arrivals rise, and local markets begin falling below ₹2,300.
For Telangana, these national levels should be used only as a broad reference. Local markets are currently reporting higher price medians, so local support and resistance can also be higher.
One further caution: the 2026–27 maize MSP is ₹2,410 per quintal, only ₹10 higher than the previous year’s ₹2,400. The national benchmark being close to MSP does not guarantee a floor under actual mandi prices.
8. Six-month price forecast: April 2027
The forecast combines current market prices, the previous record crop, lower reported kharif acreage, the monsoon and reservoir position, seasonal arrivals, and expected feed and industrial demand.
National wholesale forecast by scenario
| Scenario | Conditions required | April 2027 forecast |
|---|---|---|
| Bearish | Heavy carryover stocks, ample rabi output, weak buying or cheaper alternative feedstocks | ₹2,100–₹2,400/qtl |
| Base case | Moderately reduced output, continued feed demand and some tightening of availability | ₹2,500–₹2,850/qtl |
| Bullish | Major rabi crop shortfall, strong ethanol procurement and active export or feed demand | ₹2,900–₹3,300/qtl |
The base-case midpoint is ₹2,675 per quintal, roughly 11.5% above the current national benchmark of ₹2,400. That increase is a scenario estimate, not a predicted guaranteed return.
Regional interpretation for Telangana
Telangana’s latest reported state-level reference was ₹2,787 per quintal on 23 October 2026, already above the national median. For planning purposes, I would use the following separate ranges for Telangana wholesale markets:
| Scenario | Indicative April 2027 range |
|---|---|
| Bearish | ₹2,300–₹2,650/qtl |
| Base case | ₹2,650–₹3,000/qtl |
| Bullish | ₹3,000–₹3,300/qtl |
These are broad planning ranges, not a verified forecast for Nagarkurnool APMC specifically. Local results will depend on arrivals, grain moisture, quality, local feed mills, transport costs and demand from competing markets.
9. What would change the forecast?
The following indicators matter more than a single day’s price movement.
Factors that could push prices higher
Confirmation of smaller kharif yields; reduced rabi sowing due to water shortages; strong ethanol procurement; improving poultry-feed demand; and sustained export purchases.
Factors that could push prices lower
Heavy arrivals continuing into the new year; a better-than-expected rabi crop; large carryover inventories; ethanol plants replacing maize with cheaper rice; and weak prices in competing global markets.
The most important confirmation signal
A sustained price increase across multiple producing markets while arrivals remain substantial would suggest that demand is absorbing supply. A rise confined to a few mandis could instead reflect local shortages or differences in grain quality.
The central risk to the bullish outlook is that the record previous crop may have left enough grain available to keep buyers comfortable for longer than expected. The central risk to the bearish outlook is that the current season’s production could fall more sharply than anticipated because acreage and water availability are both under pressure.
10. Practical implications for farmers and traders
A farmer deciding whether to sell now or store maize should not base the decision solely on the April forecast. The expected price increase needs to compensate for storage losses, drying costs, finance costs and any quality deterioration.
A practical approach is to compare the net selling value today with the expected future value after all storage and financing expenses. Staggering sales reduces dependence on one market date, while regular checks of nearby mandis may reveal better net prices than holding for a national benchmark.
Buyers and feed mills should monitor both local arrivals and the prices of substitute ingredients. A rise in maize prices is more sustainable when several demand channels are competing for the same supply, rather than when it is caused by temporary disruption in one market.
Final Assesment
My assessment as of 24 October 2026 is cautiously bullish over the six-month horizon, but with meaningful near-term downside risk.
The national benchmark is currently around ₹2,400 per quintal, although reported prices in Telangana and Karnataka are higher. The previous record crop and seasonal kharif arrivals could restrict gains in the coming weeks. After that, declining acreage, water stress and the prospect of tighter rabi supplies could support prices into March–April 2027.
The base-case expectation remains ₹2,500–₹2,850 per quintal nationally by April 2027, with a higher potential range if crop losses are confirmed. The bullish case should be treated as a possibility—not a certainty—until updated production and arrival data establish that supply is actually tightening.
Research limitation: the national and state price data quoted here are the latest retrievable reports available for the stated dates, not a guarantee of the price being offered at any particular market on 24 October. The six-month price ranges are independent scenario estimates; no forecast can eliminate weather, policy or market risk.